Bank of the Bahamas Limited will hold their Annual General Meeting on Friday, November 30, 2018 at 6 p.m. at British Colonial Hilton. The Notice can be viewed in the News Section of Bank of the Bahamas Limited under Corporate Filings on the website.
Fidelity Bank (Bahamas) Limited Q3 Financial Statements 2018
Fidelity Bank (Bahamas) Limited released their Q3 Financial Statements for 2018. The Financial Statements can be viewed in the News Section of Fidelity Bank (Bahamas) Limited under Quarterly Reports on the website.
BISX Q3 Statistical Report 2018
FOR IMMEDIATE PUBLICATION
JANUARY TO SEPTEMBER 2018 STATISTICAL REPORT
BISX is pleased to announce its BISX All-Share Index and trading statistics for the nine-month period ending September 28, 2018 with comparison to the same period of 2017.
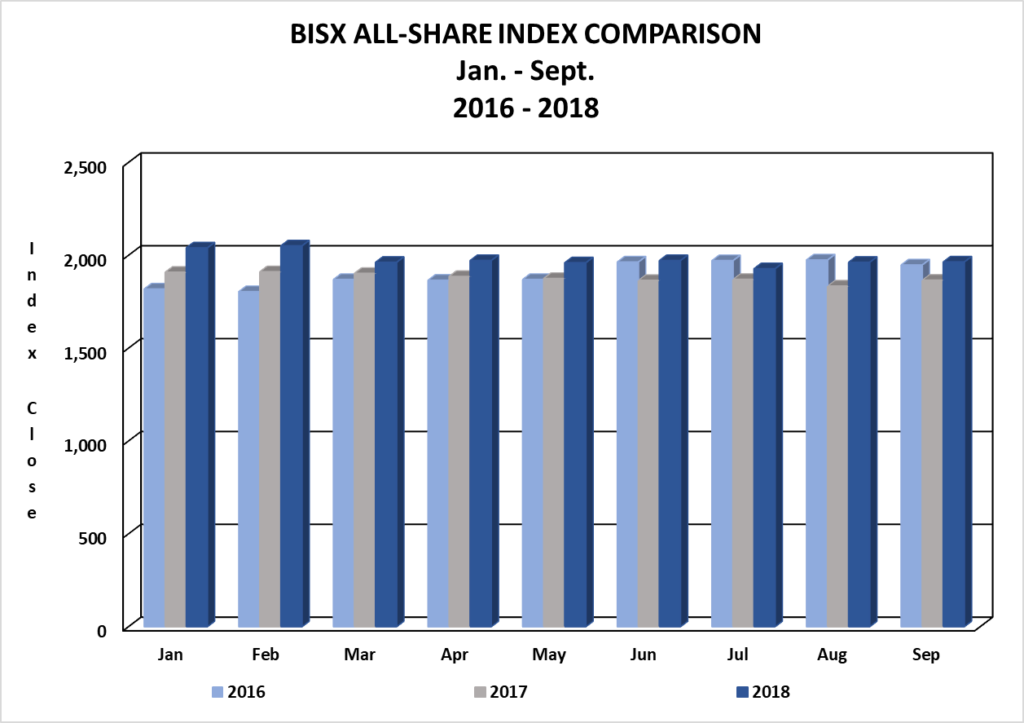
BISX ALL SHARE INDEX
For the nine-month period ending September 28, 2018 the BISX All-Share Index closed at 1,964.04 this represented a year to date decrease of 99.53 or 4.82%. By comparison for the nine-month period ending September 29, 2017 the BISX All-Share Index closed at 1,865.88 this represented a year to date decrease of 72.33 or 3.73%. The BISX All-Share Index is a market capitalization weighted index comprised of all primary market listings excluding debt securities.
As at September 28, 2018 the market was comprised of 19 ordinary shares with a market capitalization of $4.144 Billion. In addition, there were 13 preference shares with a market capitalization of $327 Million and 19 bonds with a face value of $579 Million.
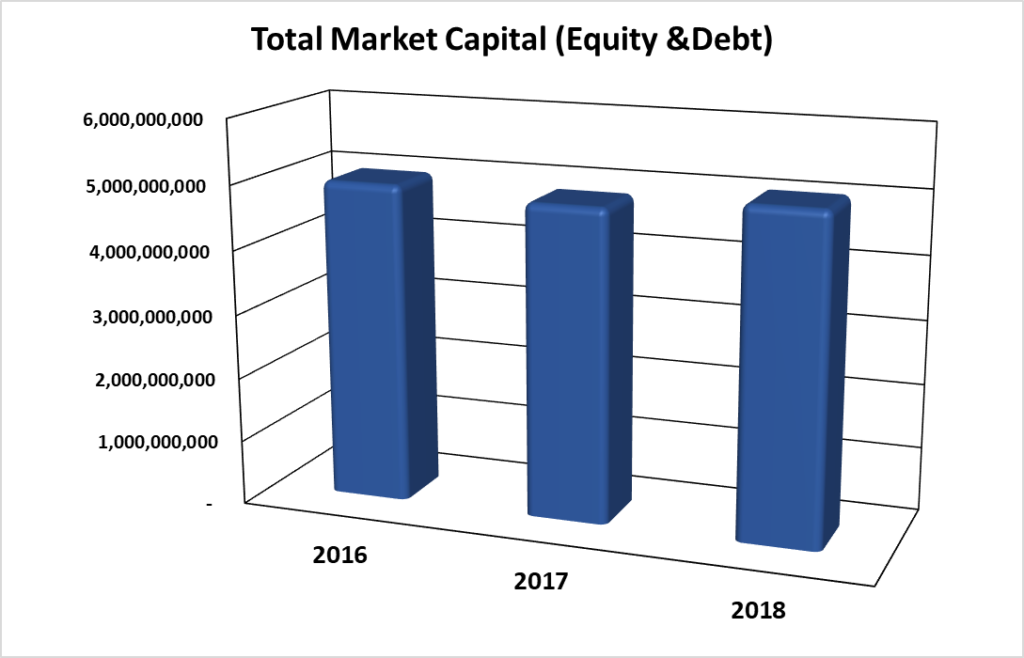
MARKET CAPITAL
Over the 3-year period 2016 to 2018, the market value of all securities listed on BISX has shown a decrease from 2016 – 2017 and an increase from 2017 – 2018, at the beginning of 2018 as indicated by the chart below:
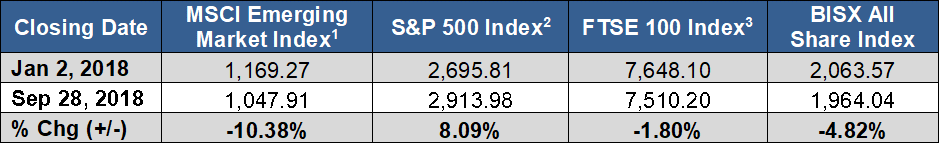
COMPARISON OF BISX ALL SHARE INDEX TO INTERNATIONAL INDICES
Over the 9-month period January 2 to September 28, 2018, international equity markets have experienced mixed performances as indicated by the chart below:
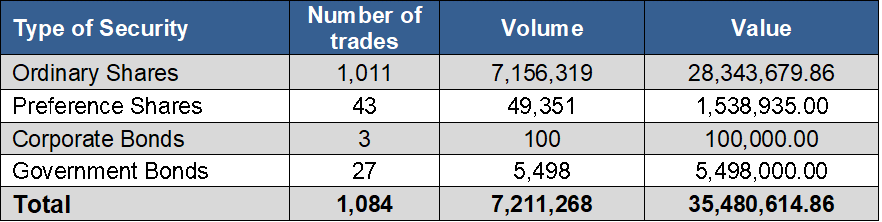
TOTAL TRADES BY SECURITY CLASS
For the nine-month period ending September 28, 2018, each type of security produced the totals in the chart below.
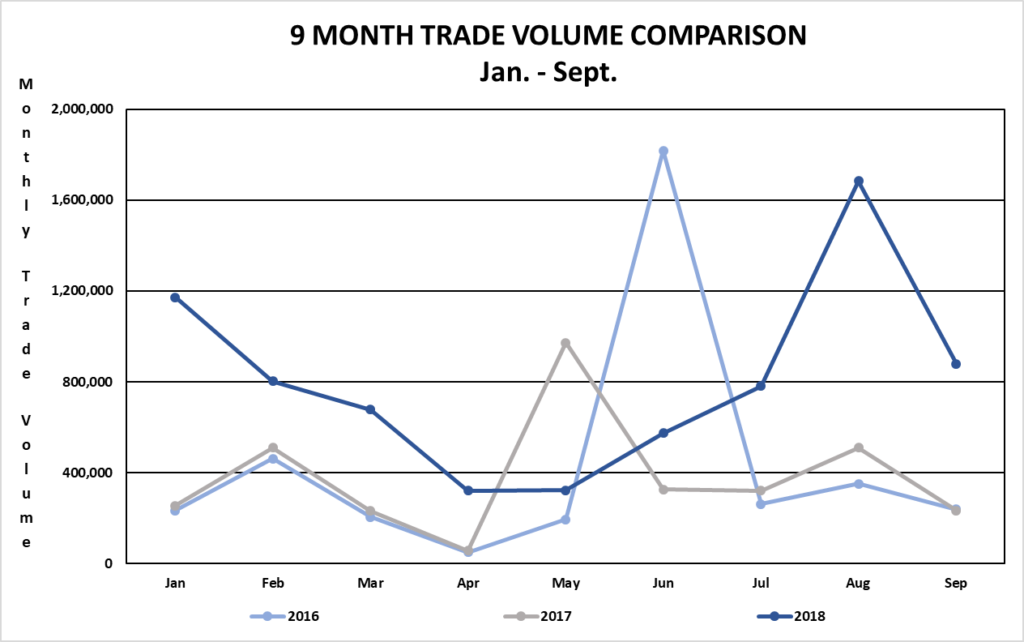
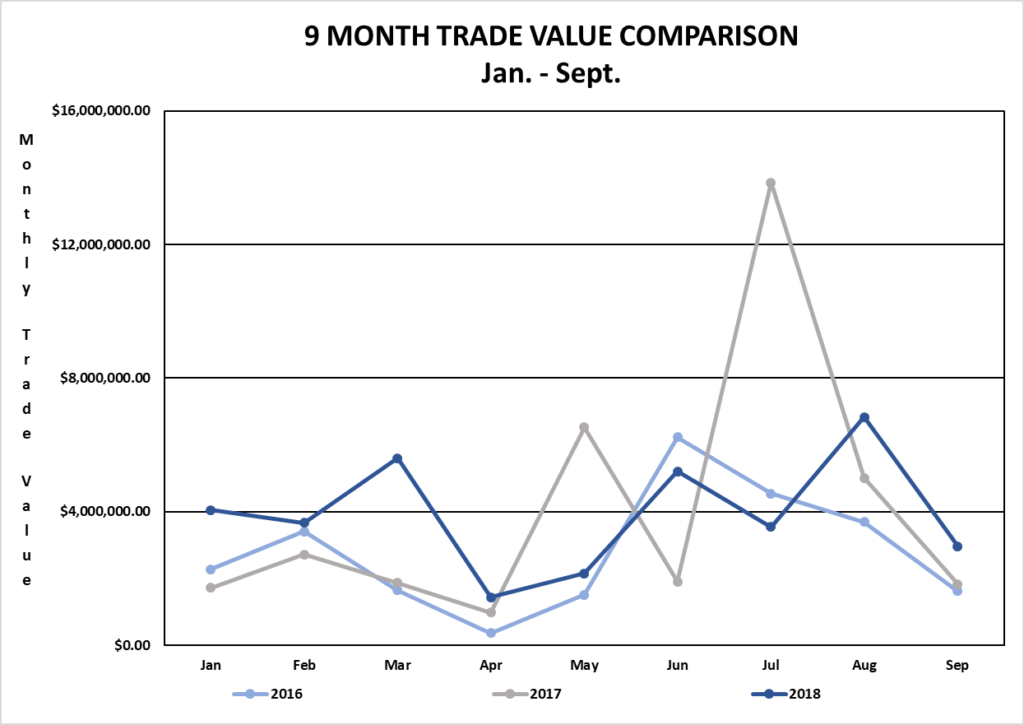
TRADING VOLUMES AND VALUES
Trading volume for the nine-month period January 2, 2018 to September 28, 2018 was 7,211,268 shares for a value of $35,480,614.86. By comparison, trading volume for the nine-month period January 1, 2017 to September 29, 2017 was 3,414,260 shares for a value of $36,445,020.43.
Trading volume for the three-month period July 1, 2018 to September 28, 2018 was 3,343,087 shares for a value of $13,346,815.61. By comparison, trading volume for the three-month period July 1, 2017 to September 29, 2017 was 1,063,957 shares for a value of $20,708,119.53.
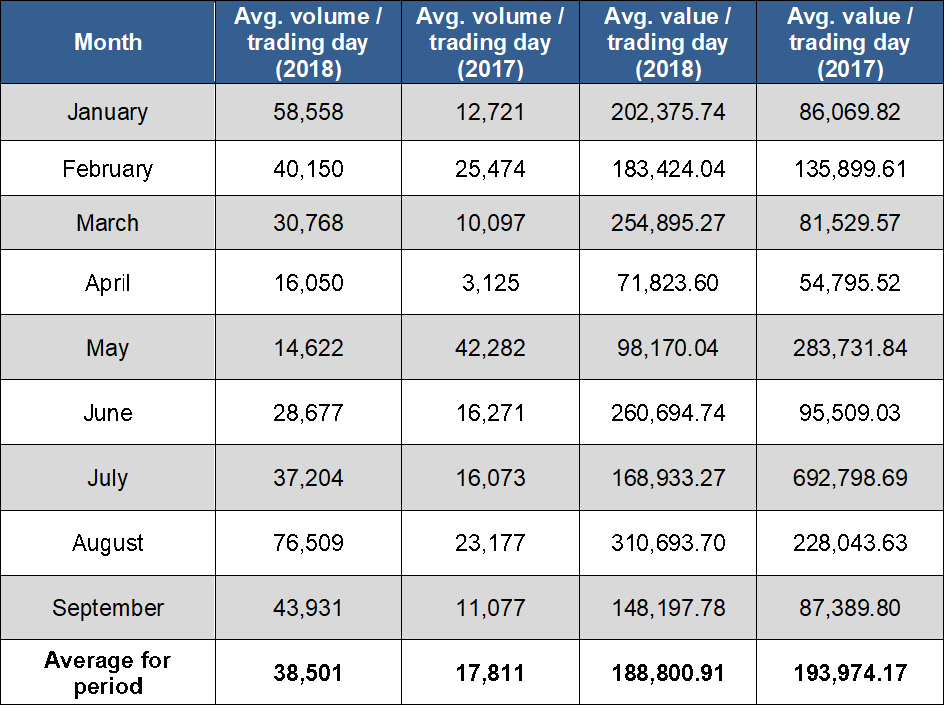
AVERAGE DAILY VOLUME AND VALUE
For the nine-month period from January 2, 2018 to September 28, 2018, the average volume per trading day was 38,501 shares for a value of $188,800.91. By comparison, for the nine-month period from January 1, 2017 to September 29, 2017, the average volume per trading day was 17,811 shares for an average value of $193,974.17.
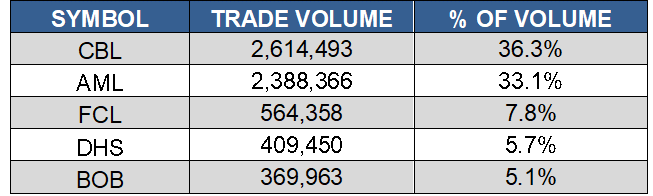
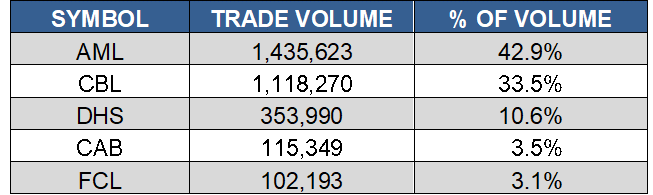
SHARE VOLUME AND VALUE LEADERS (NINE MONTH PERIOD)
The top five share volume leaders on BISX for the nine-month period January 2, 2018 to September 28, 2018 with their contribution to total traded volume displayed as a percentage were:
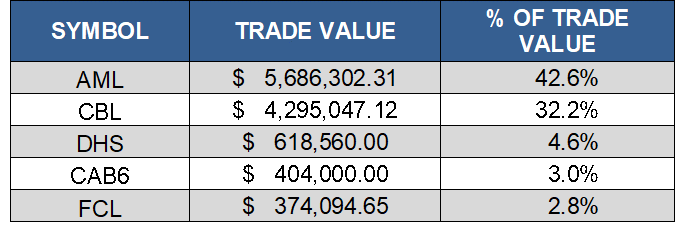
The top five share value leaders for the nine-month period January 2, 2018 to September 28, 2018 with their contribution to total traded value displayed as a percentage were:

SHARE VOLUME AND VALUE LEADERS (THREE MONTH PERIOD)
The top five share volume leaders on BISX for the three-month period July 1, 2018 to September 28, 2018 with their contribution to total traded volume displayed as a percentage were:
The top five share value leaders for the three-month period July 1, 2018 to September 28, 2018 with their contribution to total traded value displayed as a percentage were:
BISX Q3 Statistical Report 2018
BISX released their Q3 Statistical Report for 2018. The Quarterly Statistical Report can be viewed in the BISX News Section on the website.
J S Johnson Company Limited Dividend Notice (November 2018)
J S Johnson Company Limited has declared dividends of $0.15 to shareholders as of record date November 16, 2018, payable on November 23, 2018.
Emera Incorporated Q3 Financial Statements and Management Discussion and Analysis 2018
Emera Incorporated released their Q3 Financial Statements and Management Discussion and Analysis for 2018. The Financial Statements can be viewed in the News Section of Emera Incorporated under Quarterly Reports and the Management Discussion and Analysis under Corporate Filings on the website.