Cable Bahamas Limited Series 9 Dividend Notice (December 2020)
Cable Bahamas Limited declared dividends of $31.51 to shareholders on their Series 9 Preference Shares as of record date December 23, 2020, payable on December 31, 2020.
FOCOL Holdings Limited Class A Preference Share Dividend Declaration
[pdf-embedder url=”https://bisxbahamas.com/wp-content/uploads/2020/12/FOCOL-Dividend-Declaration-Payment-Class-A-Preference-Shares-Mr.-Holland-Grant-Dec-9-2020-4.pdf” title=”FOCOL – Dividend Declaration Payment – Class A Preference Shares – Mr. Holland Grant – Dec-9-2020 (4)”1
Attachments
FOCOL Holdings Limited Class A Preference Share Dividend Notice (December 2020)
FOCOL Holdings Limited declared dividends of $0.03 to their Class A Preference shareholders as of record date December 31, 2020, payable on January 15, 2021.
FOCOL Holdings Limited Class C Preference Share Dividend Notice (December 2020)
FOCOL Holdings Limited declared dividends of $0.03 to their Class C Preference shareholders as of record date December 31, 2020, payable on January 15, 2021.
FOCOL Holdings Limited Dividend Notice (December 2020)
FOCOL Holdings Limited declared dividends of $0.03 to shareholders as of record date December 31, 2020, payable on January 12, 2021.
BISX Quarterly Statistical Report Q3 2020
FOR IMMEDIATE PUBLICATION
JANUARY TO SEPTEMBER 2020 STATISTICAL REPORT
BISX is pleased to announce its BISX All-Share Index and trading statistics for the nine-month period ending September 30, 2020 with comparison to the same period of 2019.
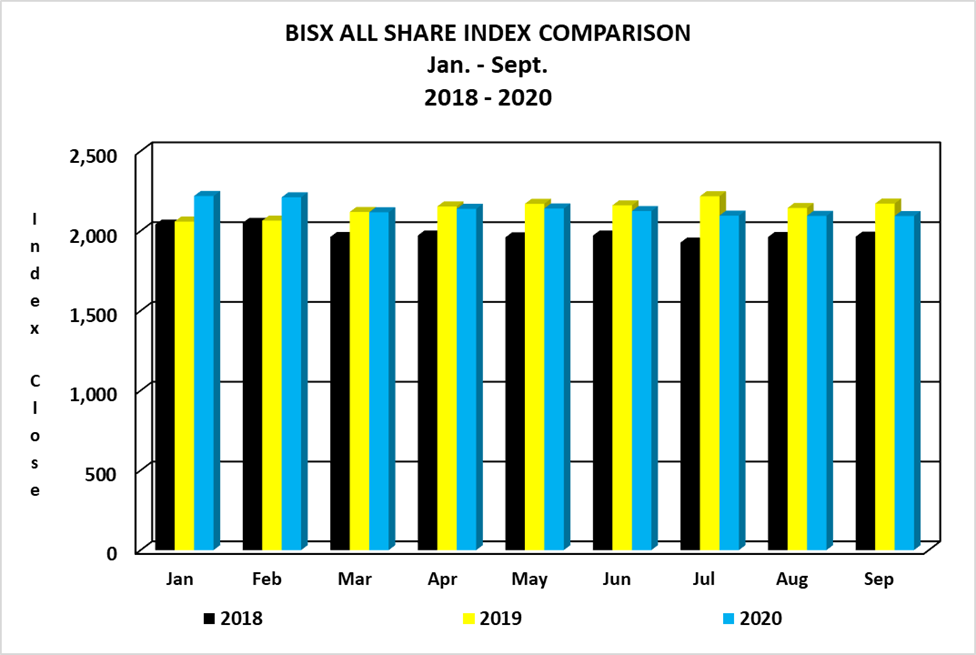
BISX ALL SHARE INDEX
For the nine-month period ending September 30, 2020 the BISX All-Share Index closed at 2,093.55, this represented a year to date decrease of 138.05 or 6.19%. By comparison for the nine-month period ending September 30, 2019 the BISX All-Share Index closed at 2,171.36, this represented a year to date increase of 61.95 or 2.94%. The BISX All-Share Index is a market capitalization weighted index comprised of all primary market listings excluding debt securities.
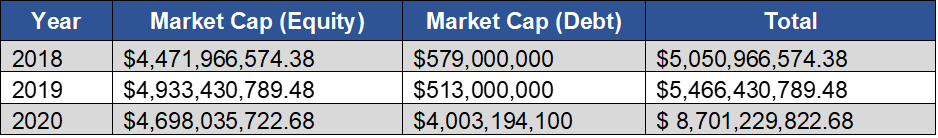
As at September 30, 2020 the market was comprised of 20 ordinary shares with a market capitalization of $4.454 Billion. In addition, there were 7 preference shares with a market capitalization of $243 Million, 11 Bahamas Government Stock and corporate bonds with a face value of $480 Million and 210 Bahamas Registered Stock (BRS) with a face value of $3.5 Billion.
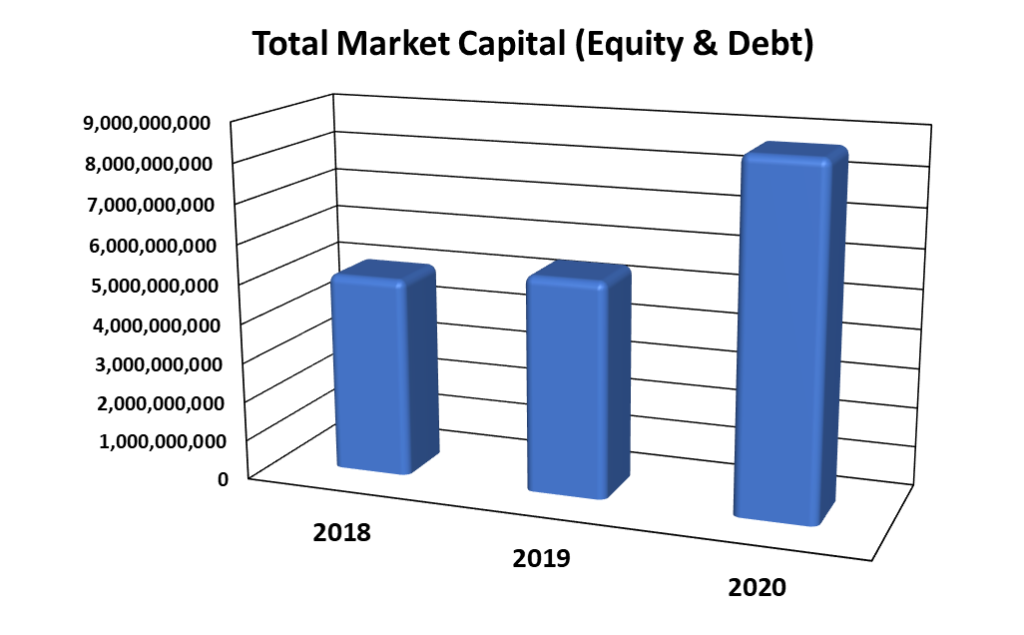
MARKET CAPITAL
Over the 3-year period 2018 to 2020, the market value of all securities listed on BISX has shown an increase from 2018 – 2019. The increase from 2019 – 2020 was due to the listing of BRS on BISX in July; as indicated by the chart below:
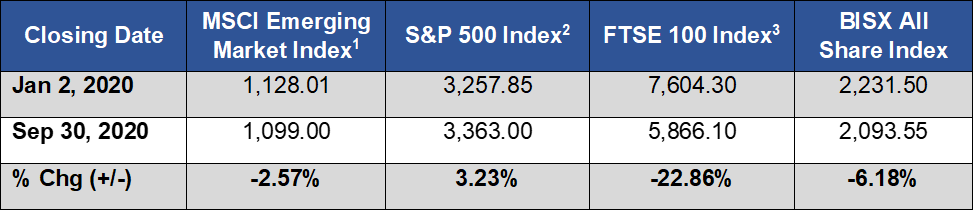
COMPARISON OF BISX ALL SHARE INDEX TO INTERNATIONAL INDICES
Over the 9-month period January 2 to September 30, 2020, some international equity markets have experienced increases and decreases as indicated by the chart below:
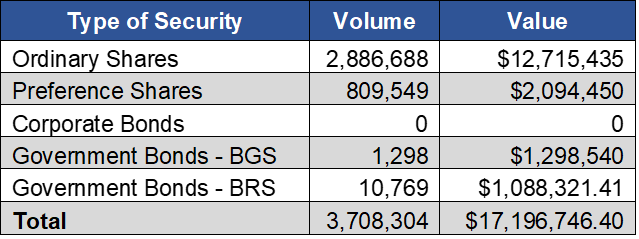
TOTAL TRADES BY SECURITY CLASS
For the nine-month period ending September 30, 2020, each type of security produced the totals in the chart below.
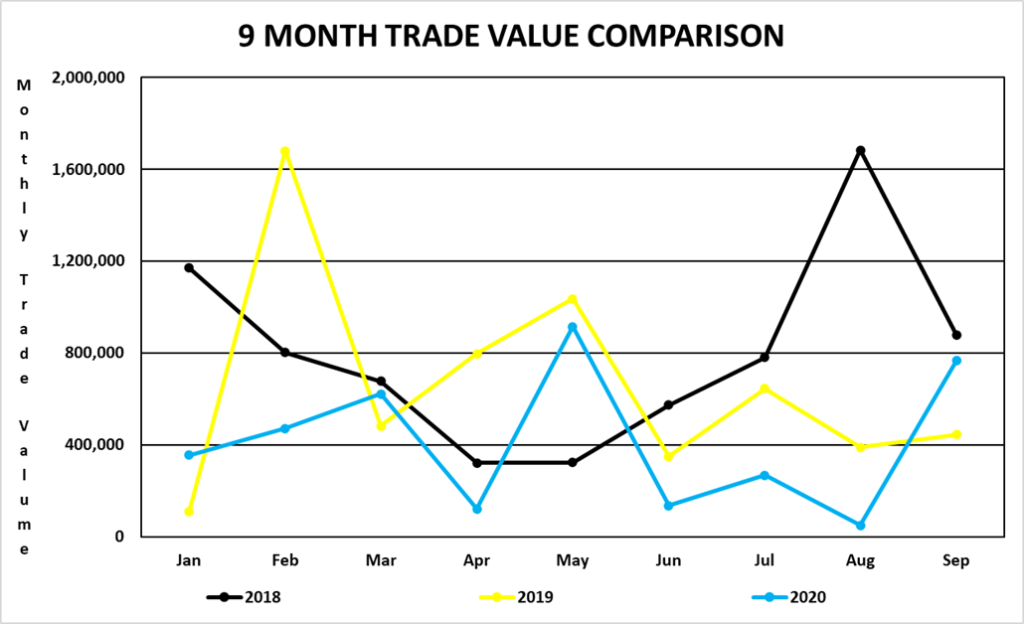
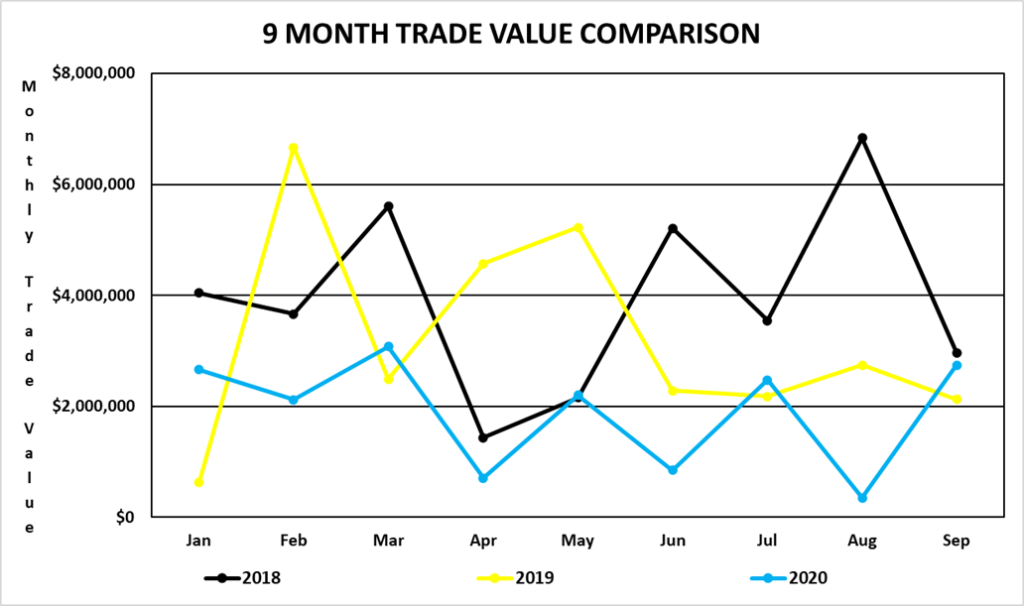
TRADING VOLUMES AND VALUES
Trading volume for the nine-month period January 2, 2020 to September 30, 2020 was 3,708,304 shares for a value of $ 17,196,746.36. By comparison, trading volume for the nine-month period January 2, 2019 to September 30, 2019 was 5,934,256 shares for a value of $28,927,245.16.
Trading volume for the three-month period July 1, 2020 to September 30, 2020 was 1,084,256 shares for a value of $ 5,574,490.68. By comparison, trading volume for the three-month period July 1, 2019 to September 30, 2019 was 1,478,146 shares for a value of $7,058,425.96.
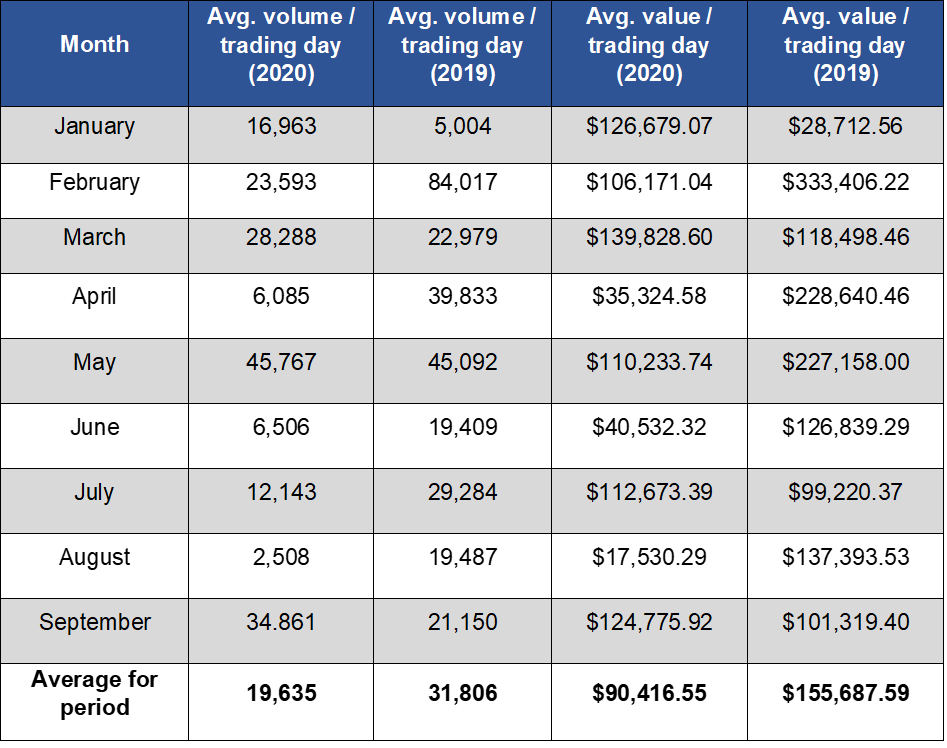
AVERAGE DAILY VOLUME AND VALUE
For the nine-month period from January 2, 2020 to September 30, 2020, the average volume per trading day was 19,635 shares for a value of $90,416.55. By comparison, for the nine-month period from January 2, 2019 to September 30, 2019, the average volume per trading day was 31,806 shares for an average value of $155,687.59.
SHARE VOLUME AND VALUE LEADERS (NINE MONTH PERIOD)
The top five share volume leaders on BISX for the nine-month period January 2, 2020 to September 30, 2020 with their contribution to total traded volume displayed as a percentage were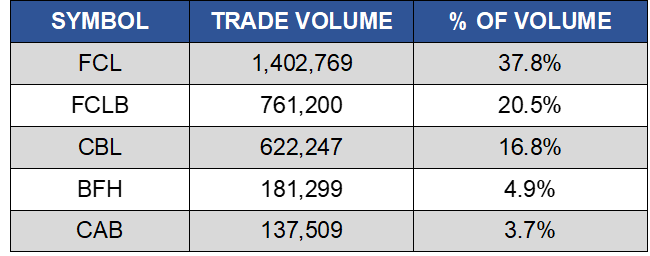
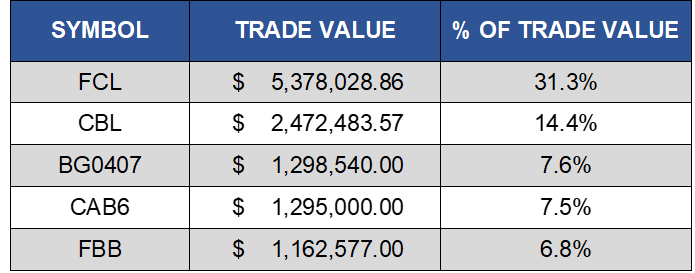
The top five share value leaders for the nine-month period January 2, 2020 to September 30, 2020 with their contribution to total traded value displayed as a percentage were:
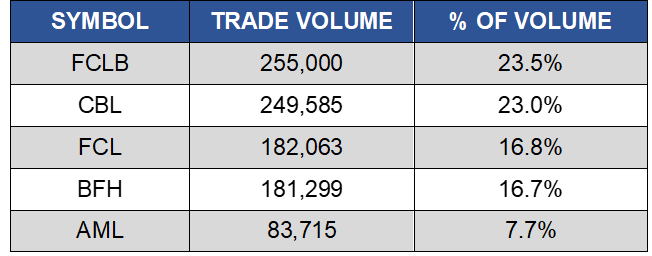
SHARE VOLUME AND VALUE LEADERS (THREE MONTH PERIOD)
The top five share volume leaders on BISX for the three-month period July 1, 2020 to September 30, 2020 with their contribution to total traded volume displayed as a percentage were:
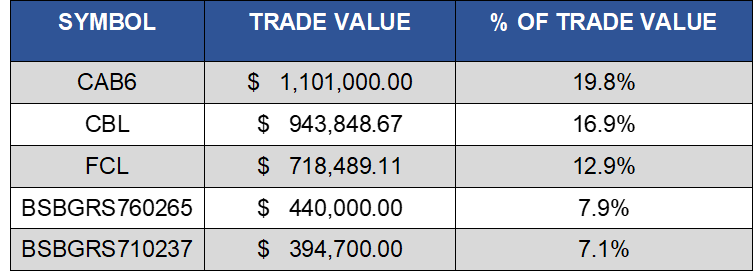
The top five share value leaders for the three-month period July 1, 2020 to September 30, 2020 with their contribution to total traded value displayed as a percentage were:
BISX Quarterly Statistical Report Q3 2020
The Bahamas International Securities Exchange released their Quarterly Statistical Report for Q3 2020. The Report can be found in the BISX News Section on the website.
- « Previous Page
- 1
- …
- 24
- 25
- 26
- 27
- 28
- …
- 181
- Next Page »